RORY L. STEVENS
Designer
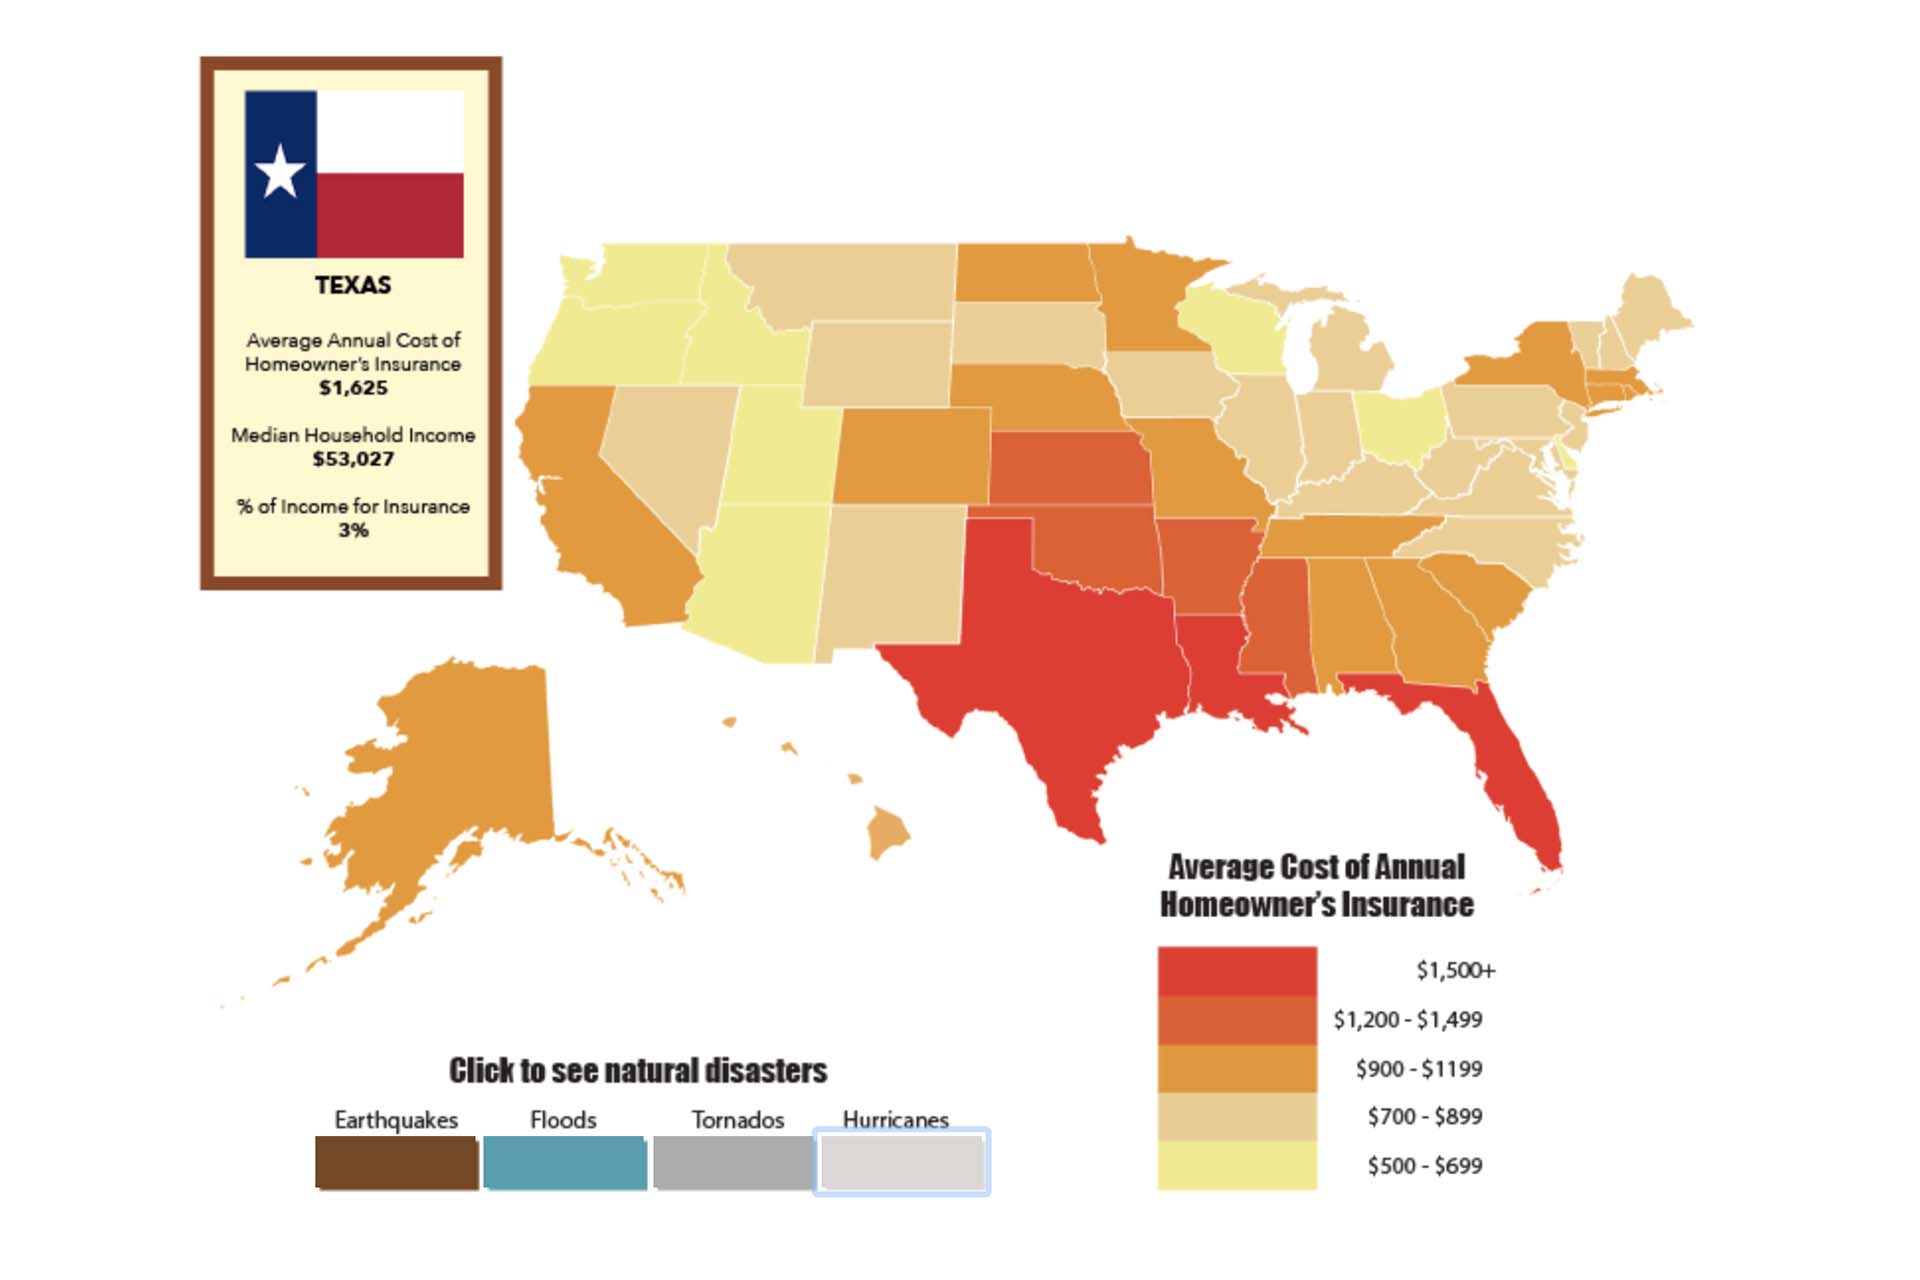
Natural Disaster Map
Interactive Information Graphic
Company
Allstate is an insurance company whose mission is to provide homeowners with quality protection.
Problem
There are potential hazards and natural disasters all over the country, and Allstate wants a way to show people the different potential natural disasters in each area of the country.
Opportunity
All the potential natural disasters around the country can be visualized on a map with different symbols representing different disasters.
Solution
The information graphic will help Allstate and its clients to see the different potential natural disasters and how they affect insurance premiums.
Target Audience
Anyone who owns a house, most likely nobody younger than their late 20’s.
Objectives
The audience wants to have a visual infographic to show them the average cost of homeowner’s insurance by state and to see how natural disasters in the area may or may not effect the cost.
Obstacles
There are probably other factors besides natural disasters that factor in a state’s average annual homeowner’s insurance cost, and the visual infographic would probably give limited data.
Key Benefit
This will mainly be a tool for clients to compare the natural disasters and homeowner’s insurance by state in an enjoyable way.
Tone
Since it’s a map of natural disasters, the colors should be orangish-yellow, the color of caution.
Media
This visual infographic will be an interactive PDF where the audience can hover over each state to get the information about the average cost for that state.